

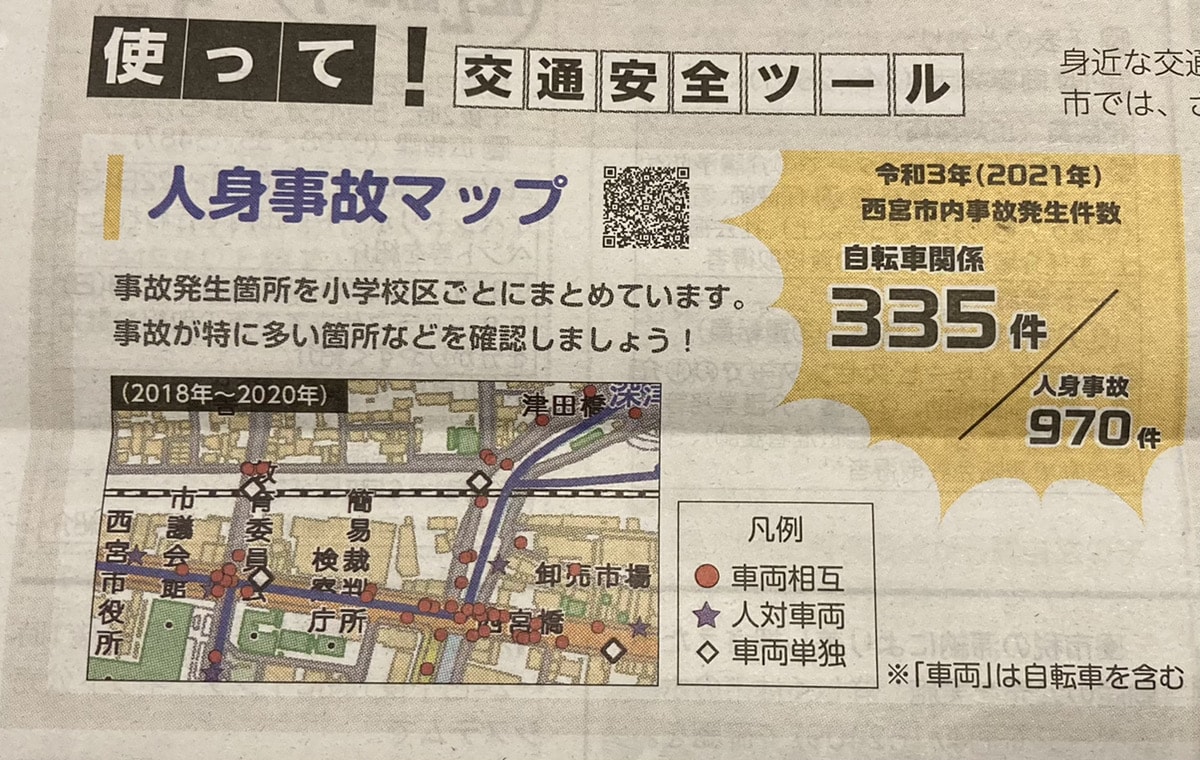

Nishinomiya City’s website has published a list of locations where accidents were especially frequent from 2018 to 2020.
(It was featured in the April 25 Nishinomiya City News.)
Here’s the source↓
Screenshot from the Nishinomiya City official website
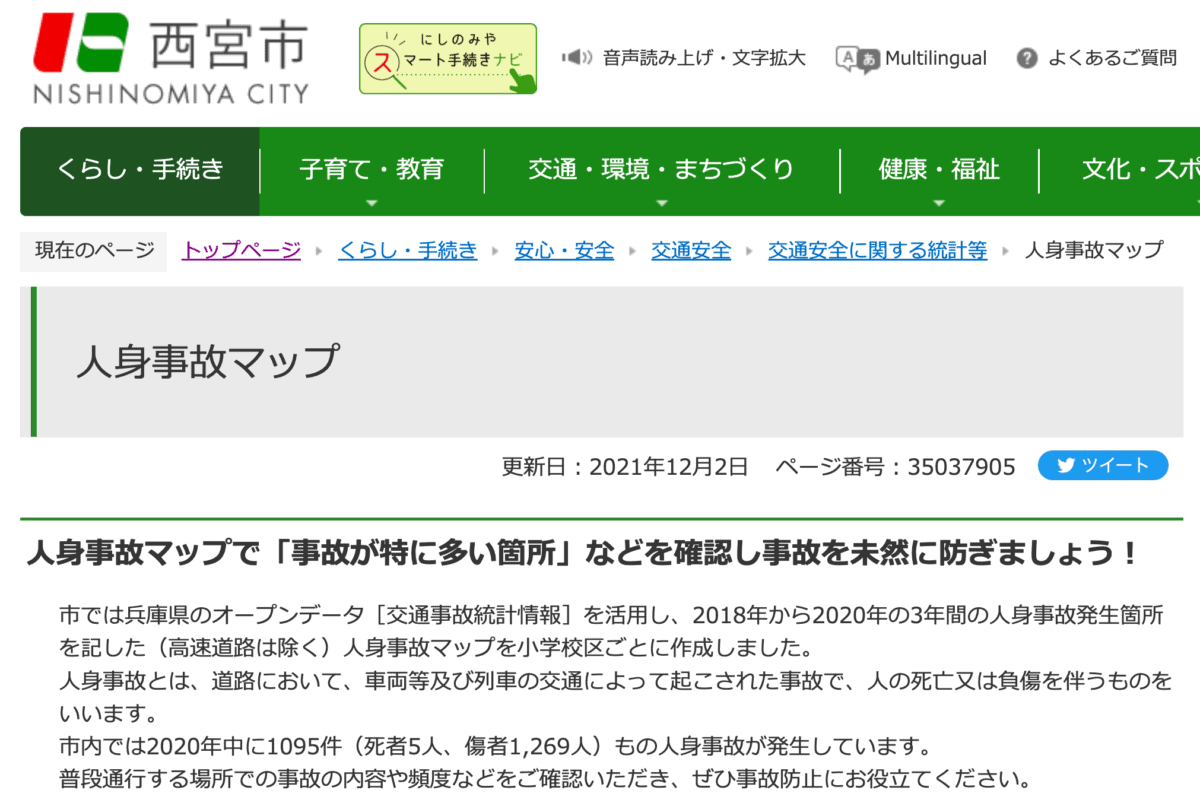
You can check a map showing the locations of traffic accidents involving injuries over the three years from 2018 to 2020.
About the Traffic Accident Injury Map
For example, here’s the map of the southern area↓
Screenshot from the Nishinomiya City official website
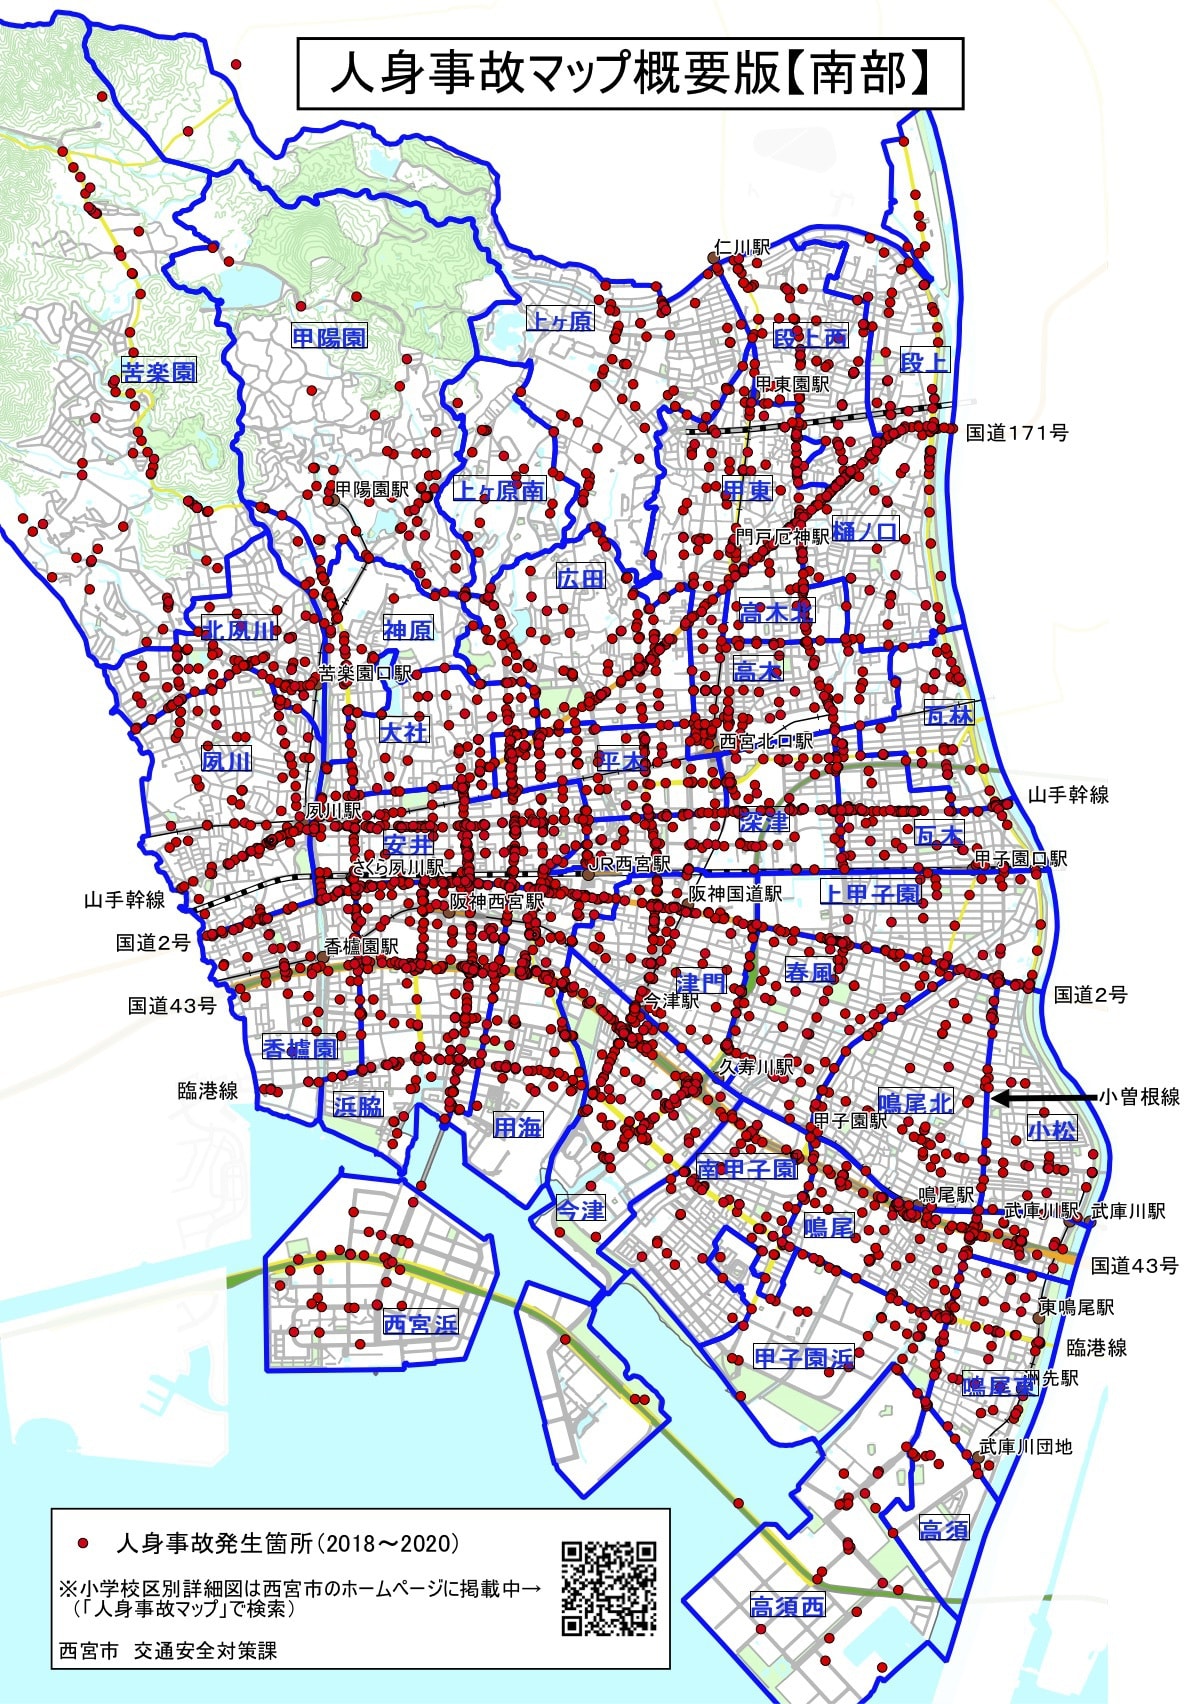
The red circles mark places where accidents involving injuries occurred. This many in just three years…! The major roads are covered in circles😣
You can also view zoomed-in maps for each elementary school district, so we checked the Shukugawa Elementary School version, where the Nishi2 office is located↓
Screenshot from the Nishinomiya City official website
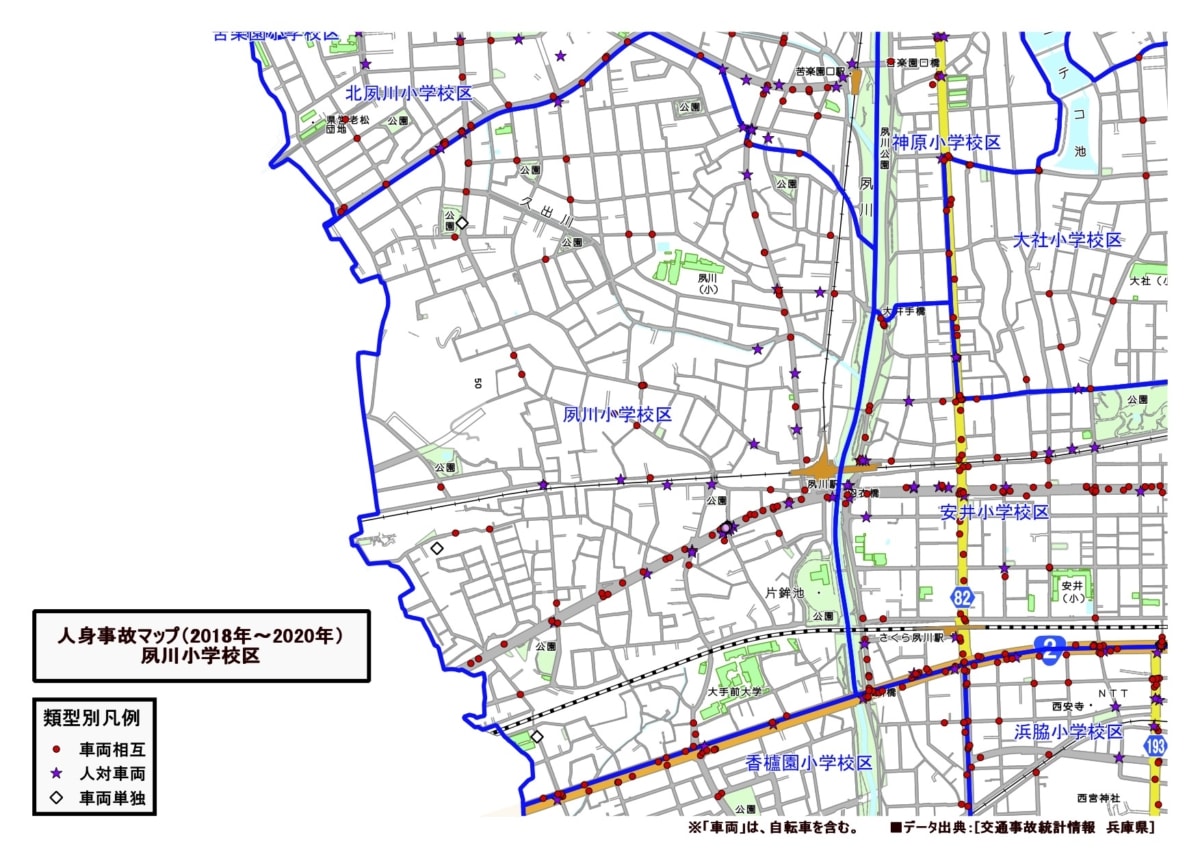
Even on the road by our office, just one street in from the main road, there was a circle marked “vehicle-to-vehicle”🙄
Finally
Even on roads we casually use every day, simply walking, driving, or riding a bicycle while keeping in mind “this is a place where an accident involving injuries happened before, so I should be careful” could help prevent accidents. Why not look over the map around your home with your family and talk about it together?😌