


We’ve put together rankings of the areas in Nishinomiya City where the population is growing and where it’s declining.
This article is brought to you by “Nishinomiya Kitaguchi Dental and Oral Surgery, open year-round ,” a dental clinic that supports Nishitsu.
Using data from the estimated population by town, we calculated the increases and decreases in population.
Will your neighborhood be on the list…? It’s suspense time.
*Although this is labeled the 2021 edition, the data covers population changes from September 2019 to December 2020.
Past editions↓
2020 edition / 2019 edition
Top 50 Areas Where the Population Increased
Here’s what the 2021 edition looks like for areas in Nishinomiya City where the population increased.
| Rank | Town name | Population increase |
|---|---|---|
| 1st | 田近野町 | 257 |
| 2nd | 高塚町 | 185 |
| 3rd | 枝川町 | 181 |
| 4th | 若山町 | 161 |
| 5th | 上大市3丁目 | 152 |
| 6th | 樋ノ口町2丁目 | 134 |
| 7th | 津門大塚町 | 133 |
| 8th | 両度町 | 96 |
| 9th | 二見町 | 91 |
| 10th | 甲子園四番町 | 89 |
| 11th | 甲子園八番町 | 85 |
| 12th | 門前町 | 82 |
| 13th | 甲子園口6丁目 | 81 |
| 甲子園六石町 | ||
| 15th | 薬師町 | 76 |
| 16th | 里中町3丁目 | 74 |
| 17th | 山口町上山口4丁目 | 70 |
| 六湛寺町 | ||
| 19th | 上田中町 | 61 |
| 20th | 浜松原町 | |
| 21st | 浜町 | 54 |
| 22nd | 神垣町 | 52 |
| 23rd | 生瀬東町 | 51 |
| 24th | 樋之池町 | 49 |
| 上ケ原山田町 | ||
| 26th | 神園町 | 47 |
| 27th | 門戸荘 | 45 |
| 28th | 神呪町 | 43 |
| 河原町 | ||
| 30th | 北昭和町 | 40 |
| 与古道町 | ||
| 32nd | 奥畑 | 39 |
| 33rd | 室川町 | 36 |
| 34th | 松原町 | 35 |
| 甲子園六番町 | ||
| 36th | 東鳴尾町2丁目 | 33 |
| 門戸東町 | ||
| 宮西町 | ||
| 39th | 城ケ堀町 | 32 |
| 40th | 上鳴尾町 | 31 |
| 松園町 | ||
| 川西町 | ||
| 43rd | 甲子園浦風町 | 30 |
| 西平町 | ||
| 甲子園砂田町 | ||
| 46th | 南甲子園1丁目 | 29 |
| 47th | 甲東園1丁目 | 28 |
| 南郷町 | ||
| 田中町 | ||
| 50th | 荒木町 | 27 |
No. 1 is 田近野町
The area with the biggest population increase in 2021 was 田近野町 (Tajikanocho)〜(ranked 7th last time). The population increased by +257 people(last time it was +70). The likely reason for the sharp increase is the completion in September 2019 of a 14-story condominium called Rune Nishinomiya Nigawa in Tajikanocho. With Mandai right in front of it, it seems pretty convenient.
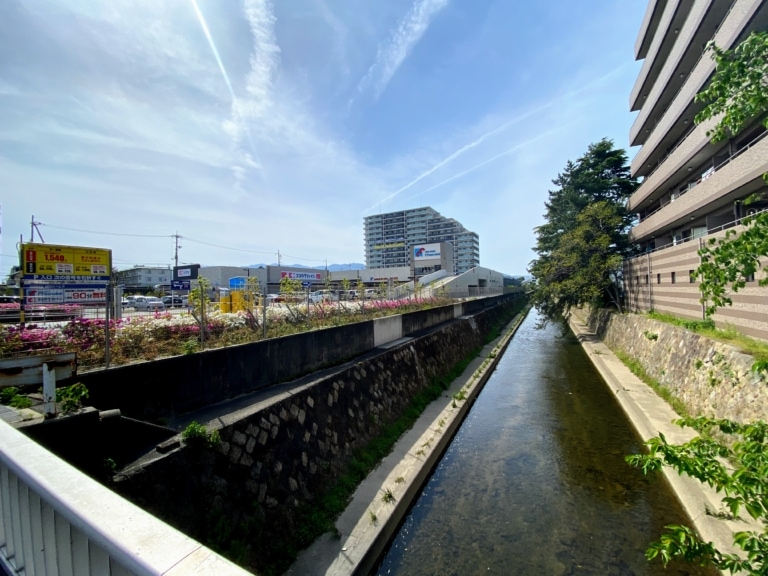
Apparently Tajikanocho used to be part of Amagasaki, and other little tidbits like that.
Feel free to check out the list of articles about “田近野町” as well.
Here it is on the map↓
No. 2 is 高塚町
In second place, 高塚町 saw an increase of
+185 people(last time it was +26). This was probably influenced by the detached-house development “Shukugawa St Terrace Shurei no Oka,” which was listed as having handovers in April 2020. A supermarket is also scheduled to open nearby in Otani-cho in September, and there was still plenty of open land, so I have a feeling it may rank high again next year.
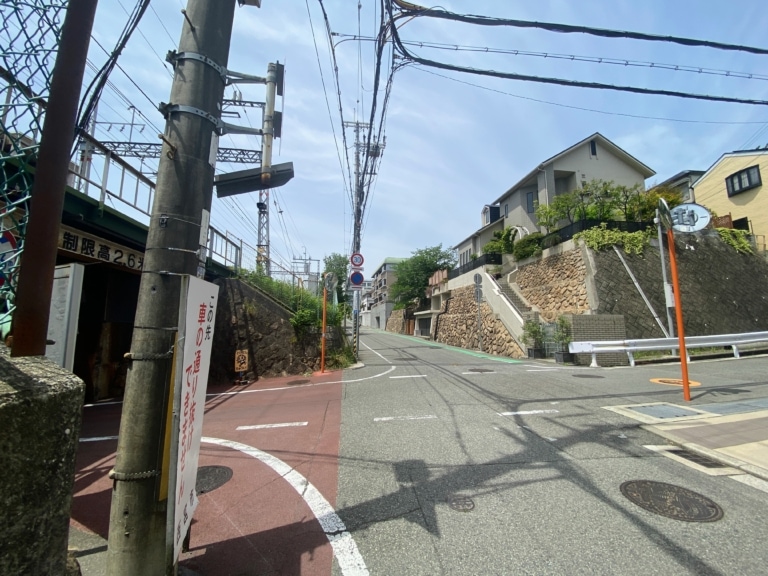
On Nishitsu, articles about Takatsukacho are basically the population-change article and one about seeing a halo on the day we went to take photos. That probably shows just how quiet and residential the area is.
List of articles about “高塚町”
Here it is on the map↓
No. 3 is 枝川町
枝川町, which ranked second last year, is near the top again this year! Its population increased by +181 people(last time it was +259). This area has many detached-house subdivisions, which is probably the reason. There’s still a lot of vacant land, so it will likely rank high again next year. Sekisui House, currently a Nishitsu banner sponsor, is also selling homes here〜(An event involving Nishitsu is planned for May).
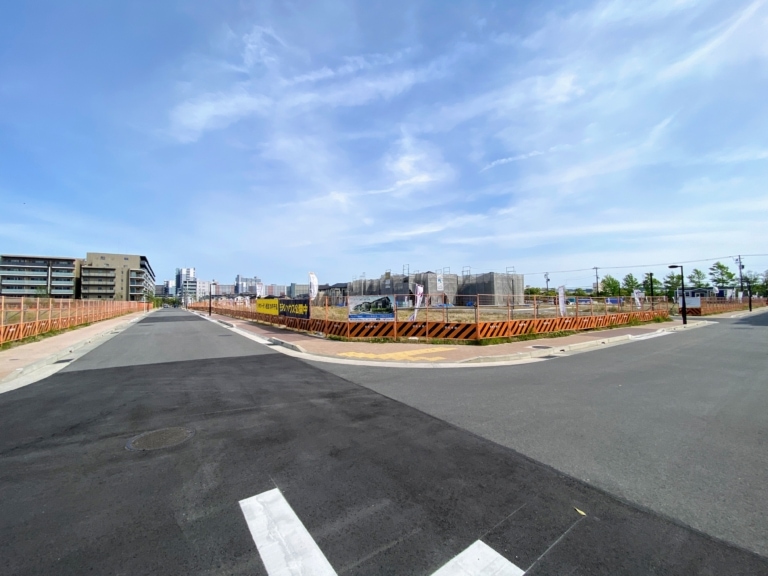
Hama-Koshien Sports Park being located in Edagawacho feels a bit like Tokyo Disneyland being in Chiba Prefecture, maybe.
List of articles about “枝川町”
Here it is on the map↓
Top 50 Areas Where the Population Decreased
Here are the areas in Nishinomiya City where the population decreased in the 2021 edition.
| Rank | Town name | Population change |
|---|---|---|
| 1st | 高須町1丁目 | -214 |
| 2nd | 上大市1丁目 | -140 |
| 3rd | 高須町2丁目 | -120 |
| 4th | 瓦林町 | -111 |
| 5th | 広田町 | -101 |
| 6th | 山口町下山口 | |
| 7th | 愛宕山 | -94 |
| 8th | 古川町 | -82 |
| 9th | 甲子園一番町 | -75 |
| 10th | 上ケ原八番町 | -71 |
| 11th | 甲子園九番町 | -69 |