We created a ranking of areas in Nishinomiya City where the population is increasing and decreasing.
Using Estimated Population by Town in Reiwa 1 (by administrative area) as the source, we looked at changes in population numbers.
*This is labeled as the 2020 edition, but the data covers October 2018 to September 2019, so in practice it shows changes from 2018 to 2019.
Last year’s edition ↓

Top 50 Areas Where the Population Increased
| Rank | Address | Increase |
|---|---|---|
| 1st | Chitose-cho | 291 |
| 2nd | Edagawa-cho | 259 |
| 3rd | Ryodo-cho | 200 |
| 4th | Koshien Harukaze-cho | 104 |
| 5th | Koshien Goban-cho | 80 |
| 6th | Koshienguchi 3-chome | 71 |
| 7th | Tajikano-cho | 70 |
| 8th | Imazu Kusugawa-cho | 67 |
| 9th | Nagata-cho | 66 |
| 10th | Okuhata | 63 |
| 11th | Kamizono-cho | 60 |
| 12th | Kunimidai 4-chome | 59 |
| 13th | Koshien-cho | 58 |
| 14th | Uegahara Yamada-cho | 57 |
| 15th | Ishibane-cho | 56 |
| 16th | Matsuzono-cho | 54 |
| 17th | Maruhashi-cho | 52 |
| 18th | Honmachi | 51 |
| 19th | Miyamae-cho | 48 |
| Koshien Urakaze-cho | ||
| 22nd | Wakakusa-cho 1-chome | 47 |
| 23rd | Otani-cho | 46 |
| 24th | Kami-Koshien 4-chome | 43 |
| 25th | Hiraki-cho | 42 |
| Kita-Showa-cho | ||
| Yamaguchi-cho Kamiyamaguchi | ||
| 29th | Toda-cho | 41 |
| 30th | Tsuto Otsuka-cho | 40 |
| Nigawa-cho 2-chome | ||
| 32nd | Araki-cho | 39 |
| 33rd | Koshimizu-cho | 38 |
| 34th | Nigawa Yurino-cho | 37 |
| 35th | Horikiri-cho | 36 |
| 36th | Kami-Oichi 2-chome | 35 |
| 37th | Kami-Kotoen 2-chome | 33 |
| 38th | Koshienguchi 2-chome | 32 |
| 39th | Minami-Koshikiiwa-cho | 31 |
| Koshien Takashio-cho | ||
| Kotoen 1-chome | ||
| Mondohigashi-machi | ||
| 43rd | Wakayama-cho | 30 |
| 44th | Tsuto Nibe-cho | 28 |
| Nigawa-cho 4-chome | ||
| 46th | Takatsuka-cho | 26 |
| Mondoso | ||
| Namaze Higashi-machi | 25 | |
| 49th | Fukaya-cho | 24 |
| Oshima-cho | ||
| Hayashida-cho | ||
| 50th | Naka-Maeda-cho | 23 |
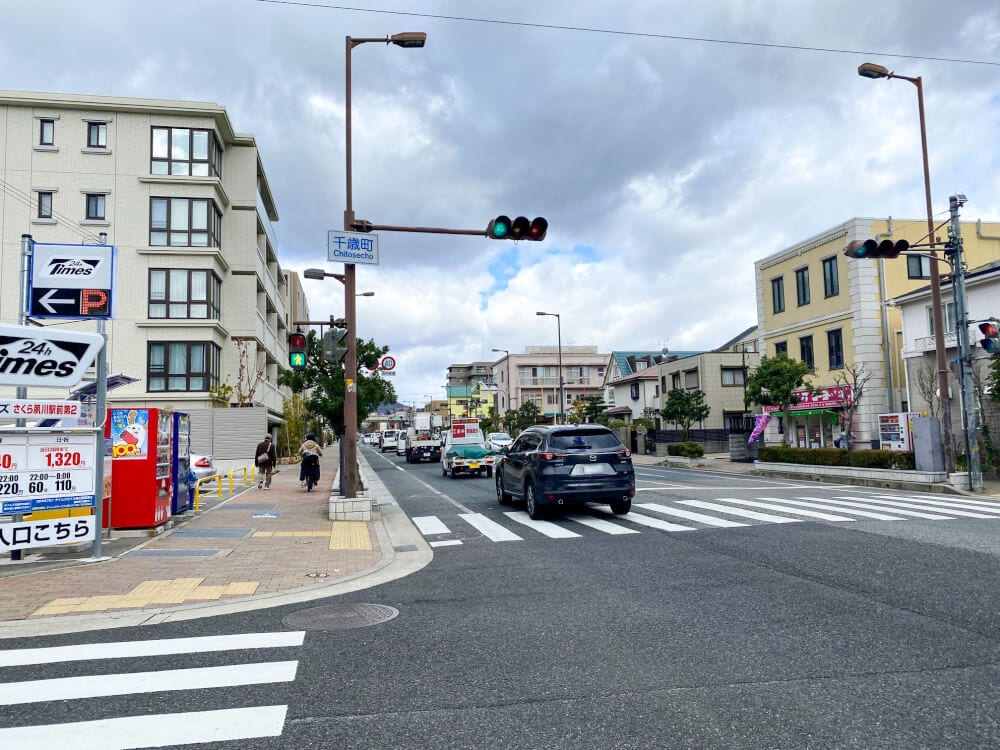
Chitose-cho Ranked No. 1 for Population Growth
The area in Nishinomiya City with the biggest population increase was Chitose-cho! Nearly 300 more people live there now.
No. 1: Chitose-cho
The main reason seems to be the completion of a new condominium in October 2018. It’s close to Hankyu Shukugawa Station and JR Sakura-Shukugawa Station, and Hankyu Shukugawa also ranked No. 1 in the “most comfortable places to live” ranking, so it makes sense that this area, where you can also use JR, is becoming popular.
Here it is on the map ↓
No. 2: Edagawa-cho
Edagawa-cho ranked No. 1 last year among areas where the population decreased, but a new condominium was built there, which is likely why the population increased. It gained 259 people.

Here it is on the map ↓
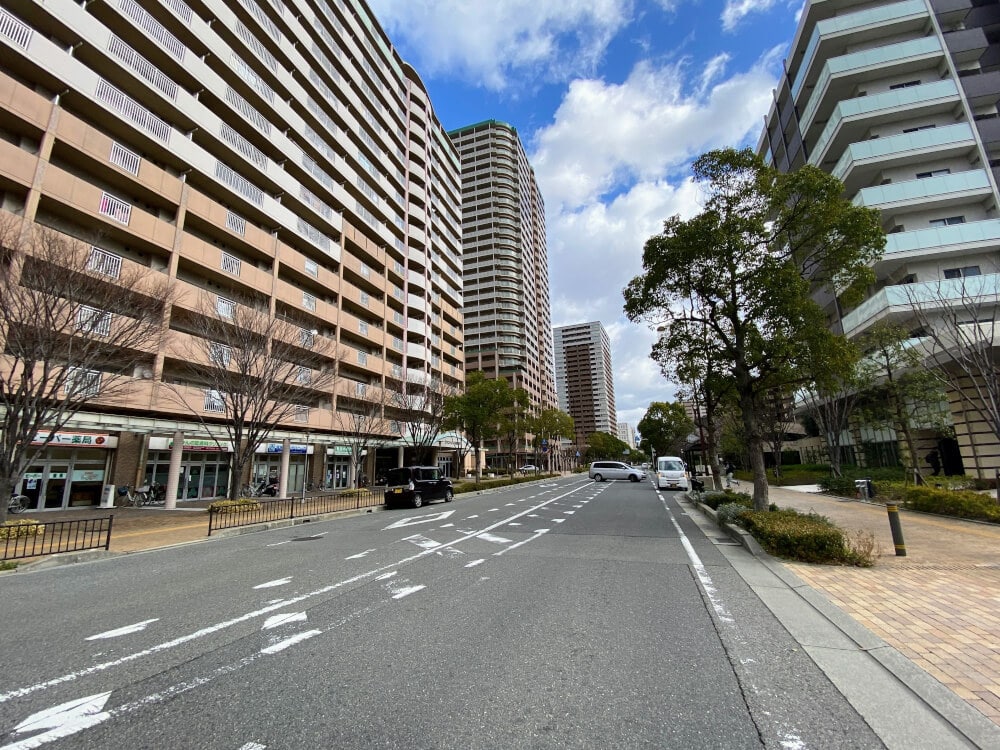
No. 3: Ryodo-cho
Ryodo-cho, last year’s No. 1, is near Nishinomiya-Kitaguchi Station, which ranked No. 1 in Kansai’s most desirable places to live, and large condominiums keep being built there. That is probably the reason. A Life supermarket is also opening nearby, so the area looks set to become even more convenient. It gained 200 people.
Here it is on the map ↓
Top 50 Areas Where the Population Decreased
| Rank | Town Name | Decrease |
|---|---|---|
| 1 | Nishinomiyahama 4-chome | -125 |
| 2 | Hirota-cho | -101 |
| 3 | Hanazono-cho | -86 |
| 4 | Higashi-Naruo-cho 2-chome | -70 |
| 5 | Kami-Oichi 1-chome | -68 |
| 6 | Koshienguchi 5-chome | -67 |
| 7 | Imazu Masago-cho | -66 |
| 8 | Komatsu Minami-machi 3-chome | -58 |
| 9 | Fushihara-cho | -55 |
| 10 | Minami-Koshien 1-chome | -54 |
| 11 | Uegahara Hachiban-cho | -49 |
| 12 | Kawazoe-cho | -48 |
| Uegahara Yonban-cho | ||
| 14 | Morishita-cho | -47 |
| Koshienguchi 6-chome | ||
| 16 | Atagoyama | -45 |
| 17 | Shishigaguchi-cho | -43 |
| Kambara | ||
| Ueda Naka-machi | ||
| 20 | Nakadono-cho | -42 |
| 21 | Shin-Koyo-cho | -41 |
| Koshien Sanban-cho | ||
| 23 | Kamino-cho | -40 |
| Kumano-cho | ||
| 25 | Noto-cho | -39 |
| Tsuto Nishiguchi-cho | ||
| 27 | Kawahara-cho | ABOUTこの記事をかいた人 主に開店・閉店、話題、まちなみを担当。
大阪出身で住まいは隣の芦屋。
第三者視点で西宮の良さを発掘すべく、街中をキョロキョロしている。    にしつーメンバー       西宮つーしんの最新情報を受け取る西宮の最新ニュースやイベント情報をプッシュ通知でお届けします。 すべてのエリアとカテゴリーの通知を受け取ります。 📍 配信エリア 西宮北口・夙川・甲子園・鳴尾・今津・甲陽園・苦楽園・門戸厄神・仁川・甲東園・山口町 など 📂 配信カテゴリー イベント・レポート・開店閉店・グルメ・クーポン・速報・求人・迷子・気象災害・行政情報・教育・インタビュー |